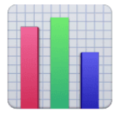
📊
bar chart (U+1f4ca)
The "📊" emoji is a column chart, also known as a bar graph. It is used to represent statistical data or information that is organized into distinct categories, with the height of each column indicating the quantity or frequency of the data within that category. This emoji is often used in business or academic contexts to convey data-driven insights or trends. It may also be used in more casual conversations to highlight a comparison or contrast between different items or ideas.
bar chart emoji text examples
- 1. "Here's a 📊 showing the results of the survey we conducted last month."
- 2. "Can you please update the sales 📊 for this quarter and share it with the team?"
- 3. "I'm having trouble understanding this 📊. Can you walk me through it?"
- 4. "According to this 📊, our revenue has increased by 20% since last year."
- 5. "Let's use this 📊 to guide our discussion during the meeting."
bar chart emoji in other languages
- 🇩🇪german:Balkendiagramm
- 🇨🇳chinese:長條圖
- 🇺🇦ukrainian:гістограма
- 🇫🇷french:diagramme à bandes
- 🇸🇦arabic:شريط الرسم البياني
- 🇯🇵japan:棒グラフ
- 🇪🇸spanish:gráfico de barras
Emoji Combinations
🪄+📊=
😂+📊=
😘+📊=
🥰+📊=
😍+📊=
🙃+📊=
😔+📊=
🥺+📊=
More Emojis from the office subcategory
View allRelated Emojis
bar chart emoji 📊 in Other Platforms
2005



2018

2021

2022
2023